flowchart LR
    P["Aiven Console<br>User Activity Generator"] -->|publish Avro| T[("Aiven Kafka Topic<br>user-activity<br>2 partitions")]
    T --> C1["Consumer 1<br>Databricks<br>Structured Streaming"]
    T --> C2["Consumer 2<br>Python Relay<br>00_relay_consumer.py"]
    C2 -->|NDJSON files| ADLS["ADLS2<br>/streaming/user-activity/"]
    ADLS -->|Snowpipe AUTO_INGEST| SF["Snowflake<br>Snowpipe + Dynamic Tables"]

    style P fill:#475569,color:#fff,stroke:#334155
    style T fill:#d97706,color:#fff,stroke:#b45309
    style C1 fill:#0369a1,color:#fff,stroke:#075985
    style C2 fill:#475569,color:#fff,stroke:#334155
    style ADLS fill:#0057b8,color:#fff,stroke:#003d82
    style SF fill:#0369a1,color:#fff,stroke:#075985
Module 8: Streaming Data Processing (Optional)
Optional · Live demand for YellowLine NYC


Duration: 90 min — Animation (3) · Think & Discuss (8) · Theory (20) · Quiz (3) · Practice (56)
NoteBefore you start — Snowflake role & compute
1. Animation
Story animation — mod-08-streaming.mp4
If the video is unavailable in the room, your facilitator will walk through the same story beats live.
2. Think & Discuss
Situation: Marcus needs live visibility for dispatch. Elena schedules Phase 2. Labs use Aiven Kafka user-activity as a teaching proxy (same streaming patterns; different dataset than NYC Taxi Parquet).
Prompts:
- What does Marcus need that yesterday’s batch pipeline cannot give him?
- When is batch still the right answer? Name one reason streaming is not worth the complexity.
- In one sentence each: what is a Kafka topic, partition, and offset?
- Would you read Kafka directly in Databricks, or relay to ADLS2 then Snowpipe? What trade-off drives that choice?
- Why do stream processors use watermarks? What breaks without them?
- Priya — She wants a Power BI page that refreshes every minute. Which streaming Gold output supports that — and why DirectQuery instead of Import?
Note
Facilitator note: YellowLine NYC would stream taxi GPS or dispatch events. We use Aiven user-activity so every attendee gets a live Kafka topic without TLC streaming infrastructure.
3. Theory
WarningStory vs lab dataset
| Layer | Content |
|---|---|
| Story / animation | YellowLine NYC live taxi zone demand |
| Lab | Aiven Kafka user-activity events |
In class: YellowLine NYC would stream live taxi GPS. The lab uses Aiven user-activity events so every attendee gets a live Kafka topic without TLC streaming infrastructure.
NoteLSDP evolution
Production streaming on Databricks may use LSDP CREATE STREAMING TABLE / @dp.materialized_view — lab uses Structured Streaming notebooks for clarity.
NoteMosaic AI streaming scoring
Production Databricks deployments may use Mosaic AI Model Serving for real-time scoring of streaming data. This module focuses on data engineering streaming patterns; AI/ML serving is covered in Module 9.
NoteOptional Module
Delivered after the main workshop day if time permits, or as a standalone advanced session. Requires Modules 2 and 3 (Databricks and Snowflake batch pipelines) as prerequisites.
Dataset: Aiven User Activity Events
Unlike the NYC Taxi data (historical batch files), this module uses a live data source: simulated user activity events generated by Aiven’s built-in User Activity data generator. The generator publishes events continuously to an Aiven Kafka topic for up to 4 hours.
NoteWhy Aiven User Activity?
- No external API key or web scraper needed — Aiven generates events from the console
- Familiar e-commerce event types:
view,click,scroll,search,purchase - Per-country breakdowns — realistic for analytics dashboards
- Simple Avro schema — teaches schema registry concepts natively
Event fields:
| Field | Type | Description |
|---|---|---|
timestamp |
ISO8601 string | When the event happened |
user_id |
string | Anonymous user identifier |
action |
string | view, click, scroll, search, purchase |
page |
string | Which page the user visited |
country |
string | 2-letter ISO country code (e.g. DE, US, FR) |
TipAvro and Schema Registry
Aiven publishes events in Avro format using the built-in Karapace Schema Registry (Confluent-compatible). Each Kafka message has a 5-byte prefix: 1 magic byte + 4-byte schema ID. Spark’s from_avro() function handles decoding once those prefix bytes are stripped.
Batch vs Streaming
The core difference
| Batch | Streaming | |
|---|---|---|
| Trigger | Scheduled (cron, manual) | Continuous / event-driven |
| Latency | Minutes to hours | Milliseconds to minutes |
| Data unit | A file or table snapshot | An individual event |
| Processing | Read all → transform → write | Read new → transform → append |
| Errors | Retry the whole job | Replay from last offset/checkpoint |
| Cost model | Burst compute when job runs | Baseline compute always running |
Kafka fundamentals
- Topic: named channel —
user-activity - Partition: parallel lanes within a topic (2 partitions on Aiven free tier)
- Offset: sequential position of an event within a partition — consumers track where they left off
- Consumer group: a group of consumers sharing work; each partition assigned to one consumer
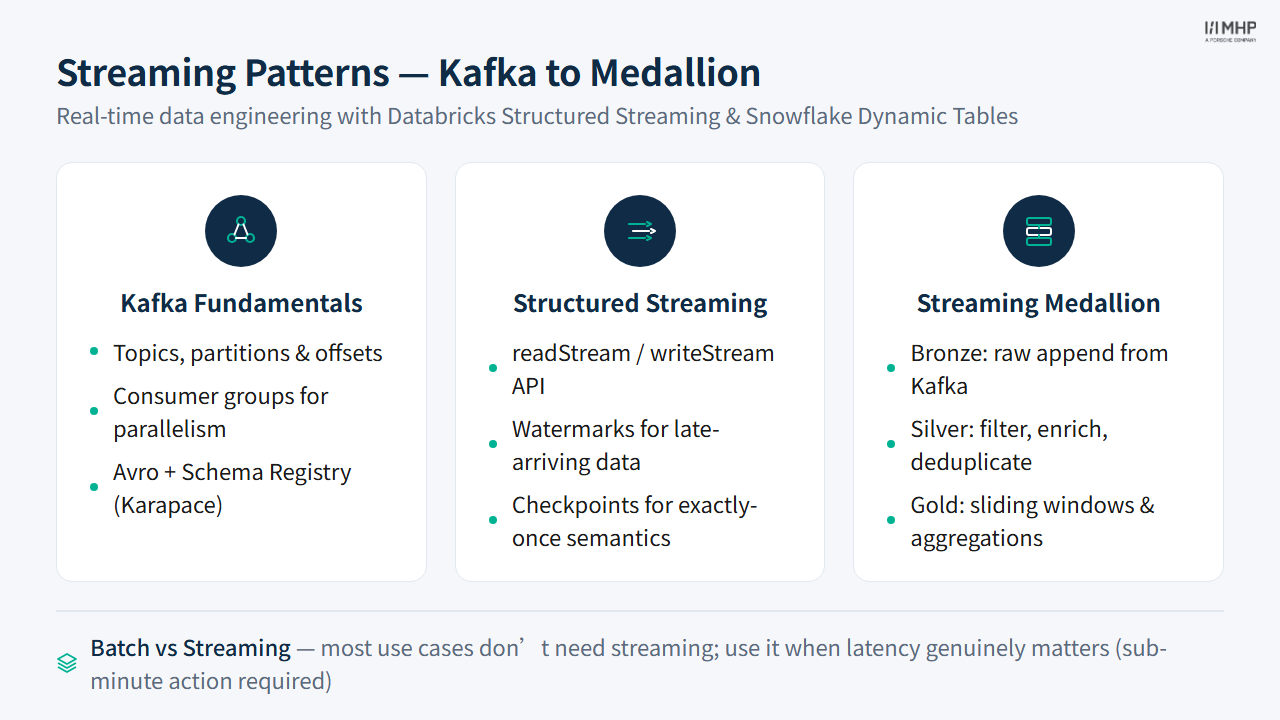
Watermarks and late data
In real-time systems, events can arrive out of order (network delays, retries). A watermark tells the stream processor: “ignore events older than X minutes — they’re too late.”
.withWatermark("event_timestamp", "10 minutes")Without a watermark, the engine would have to wait forever for potentially late events. With one, it can make windows final and free state memory.
Choosing your watermark threshold
The watermark value is a tradeoff between completeness and latency. Too short (e.g., 1 minute) and you drop valid late-arriving events; too long (e.g., 1 hour) and the engine holds state in memory far longer, increasing cost and delaying window finalization. For most IoT and event-tracking workloads, 10 minutes is a reasonable default. Monitor dropped-event metrics in production and adjust based on observed late-data patterns.
Checkpoint location is not optional
Every Structured Streaming query must have a checkpoint location on cloud storage (ADLS2, S3). Without one, restarting the query reprocesses all data from the beginning — duplicating every event. The checkpoint stores the exact offset the query last processed, enabling exactly-once semantics when combined with Delta Lake’s transaction log. Never delete a checkpoint directory unless you intentionally want to reprocess from scratch.
Architecture overview
flowchart TD
    GEN["Aiven Console<br>User Activity Generator"]
    AIVEN[("Aiven Kafka<br>topic: user-activity<br>2 partitions")]

    GEN --> AIVEN

    AIVEN --> DB_B["Bronze<br>Delta table<br>append"]
    AIVEN --> RELAY["Relay Consumer<br>00_relay_consumer.py"]
    RELAY -->|NDJSON| ADLS["ADLS2<br>/streaming/user-activity/"]
    ADLS -->|Snowpipe AUTO_INGEST| SF_B["Bronze<br>STREAMING_BRONZE_USER_ACTIVITY<br>VARIANT"]

    subgraph DB ["Databricks Structured Streaming"]
        DB_B --> DB_S["Silver<br>user_activity_silver<br>filter + enrich"]
        DB_S --> DB_G["Gold<br>activity_by_country_5min<br>sliding window"]
    end

    subgraph SF ["Snowflake Dynamic Tables"]
        SF_B --> SF_S["Silver<br>STREAMING_SILVER_USER_ACTIVITY<br>Dynamic Table, lag 1 min"]
        SF_S --> SF_G["Gold<br>STREAMING_GOLD_ACTIVITY_BY_COUNTRY<br>Dynamic Table, lag 1 min"]
    end

    subgraph DBT ["dbt (Snowflake backend)"]
        SF_B --> DBT_S["Silver<br>streaming_silver_user_activity<br>dynamic_table materialization"]
        DBT_S --> DBT_G["Gold<br>streaming_gold_activity_by_country<br>dynamic_table materialization"]
    end

    style GEN fill:#475569,color:#fff,stroke:#334155
    style AIVEN fill:#d97706,color:#fff,stroke:#b45309
    style RELAY fill:#475569,color:#fff,stroke:#334155
    style ADLS fill:#0057b8,color:#fff,stroke:#003d82
    style DB_B fill:#475569,color:#fff,stroke:#334155
    style DB_S fill:#0369a1,color:#fff,stroke:#075985
    style DB_G fill:#01065c,color:#fff,stroke:#000940
    style SF_B fill:#475569,color:#fff,stroke:#334155
    style SF_S fill:#0369a1,color:#fff,stroke:#075985
    style SF_G fill:#01065c,color:#fff,stroke:#000940
    style DBT_S fill:#0369a1,color:#fff,stroke:#075985
    style DBT_G fill:#01065c,color:#fff,stroke:#000940
Comparison: Batch vs Streaming per Tool
| Aspect | Databricks Batch | Databricks Streaming | Snowflake Batch | Snowflake Dynamic Tables | dbt Batch | dbt dynamic_table |
|---|---|---|---|---|---|---|
| Trigger | Manual / scheduled | Micro-batch (default: ASAP) or availableNow; continuous trigger is experimental |
Manual / Task | Auto (TARGET_LAG) | Manual / cron | Auto (TARGET_LAG) — Snowflake-only materialization |
| Min latency | Minutes | Sub-second (continuous, experimental) / seconds (micro-batch) | Minutes | Configurable TARGET_LAG (set any duration; typical minimum viable lag is minutes for incremental) |
Minutes | Same as Dynamic Tables — delegates to Snowflake |
| API style | PySpark DataFrame | Structured Streaming (readStream / writeStream) |
SQL / Snowpark | SQL | SQL (Jinja) | SQL (Jinja) |
| Watermarks | N/A (batch is point-in-time) | Manual .withWatermark() on event-time column |
N/A | N/A — uses incremental refresh internally, no watermark concept | N/A | N/A — delegates to Snowflake Dynamic Tables |
| State mgmt | N/A | Checkpoint files on cloud storage (Delta Lake; exactly-once semantics) | N/A | Snowflake-managed (no configuration required) | N/A | Snowflake-managed |
| Snowpipe ingest | N/A | N/A | File-based (Snowpipe) | File-based (Snowpipe via relay consumer, ADLS2) | N/A | File-based (same Snowpipe) |
| Complexity | Low | Medium-High (watermarks, checkpoints, exactly-once, schema evolution) | Low | Low | Low | Low |
When to choose streaming over batch
Tip
Most data engineering use cases don’t need streaming. Ask these questions first:
- Does the business need results in under 5 minutes?
- Will the action taken on the data expire if delayed by an hour?
- Is the data volume too high to process in batch windows?
If the answer to all three is “no” → batch is simpler, cheaper, and more reliable.
Streaming adds operational complexity: watermarks, checkpoints, exactly-once semantics, state store management. Use it when latency genuinely matters.
Snowflake note: Snowpipe Streaming is insert-only — you cannot update or delete rows through the streaming ingest API. Transformations and merges must happen in Downstream Dynamic Tables or Tasks.
Databricks note: True continuous processing (trigger(continuous=...)) remains experimental. Most production workloads use micro-batch triggers with a processing time interval (e.g. trigger(processingTime='10 seconds')) or availableNow for bulk-replay scenarios.
3.1 Key Takeaways
- Most use cases don’t need streaming — batch is simpler, cheaper, and more reliable; use streaming only when sub-5-minute latency is a genuine business requirement
- Databricks Structured Streaming uses micro-batch processing with explicit watermarks and checkpoints — full control, higher complexity
- Snowflake Dynamic Tables are declarative — you write SQL, Snowflake manages incremental refresh via
TARGET_LAG - dbt
dynamic_tablematerialization brings governance (tests, lineage, docs) to streaming tables on Snowflake - Checkpoint locations enable exactly-once semantics — never delete them unless you intend to reprocess from scratch
- Watermark threshold is a tradeoff between completeness (longer = fewer dropped events) and cost (longer = more state in memory)
4. Quiz
Quiz: Module 8 — Streaming Quiz
Before moving on, make sure you can answer:
- What three questions should you ask before choosing streaming over batch?
- What is the purpose of a watermark in a streaming pipeline, and what happens if you set it too short?
- How does Snowflake’s Dynamic Table approach differ from Databricks Structured Streaming in terms of state management?
5. Practice
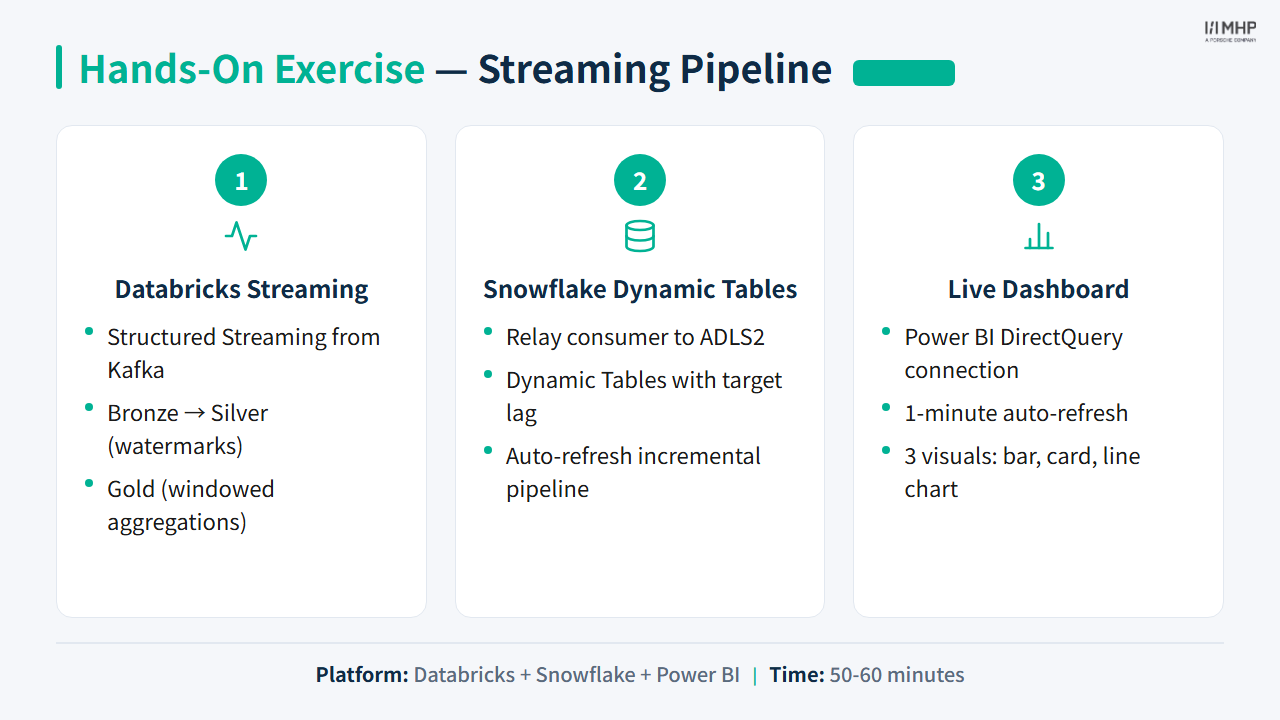
Part 1: Databricks Structured Streaming
Databricks uses Apache Spark Structured Streaming — a micro-batch engine that reads new Kafka messages every few seconds and processes them as a mini DataFrame.
Key pattern: readStream → transform → writeStream
# Read — streaming DataFrame (never terminates)
df_stream = spark.readStream.format("kafka").options(**kafka_opts).load()

# Transform — exactly like a batch DataFrame
df_parsed = df_stream.select(from_json(col("value"), schema).alias("e")).select("e.*")

# Write — streaming query (runs until stopped)
query = df_parsed.writeStream.format("delta").outputMode("append") \
    .option("checkpointLocation", checkpoint_path).toTable("my_table")
The API is almost identical to batch — readStream instead of read, writeStream instead of write.
Windowed aggregation
from pyspark.sql.functions import window

df_gold = (
    df_silver
    .withWatermark("event_timestamp", "10 minutes")
    .groupBy(
        window(col("event_timestamp"), "5 minutes", "1 minute"),  # sliding window
        col("country")
    )
    .agg(count("*").alias("event_count"))
)
A sliding window of 5 minutes with a 1-minute slide means: - At 09:05, the window covers 09:00–09:05 - At 09:06, a new window opens covering 09:01–09:06 - Each event belongs to up to 5 active windows simultaneously
Exercise: Run the Databricks streaming pipeline
See Exercise: Streaming for full instructions.
Notebooks to run in order:
streaming/databricks/01_streaming_bronze.py— Kafka → Bronze Delta (Avro decode)streaming/databricks/02_streaming_silver.py— Bronze stream → Silver (type + classify)streaming/databricks/03_streaming_gold.py— Silver stream → Gold (sliding window by country)
Verify (run repeatedly to watch counts grow):
SELECT COUNT(*), MAX(bronze_processing_timestamp)
FROM {attendee_id}_streaming.user_activity_bronze;

SELECT country, SUM(event_count) AS total_events
FROM {attendee_id}_streaming.activity_by_country_5min
GROUP BY country ORDER BY total_events DESC LIMIT 10;
Part 2: Snowflake Relay Consumer + Snowpipe + Dynamic Tables
Snowflake’s approach to streaming is declarative: you write SQL, Snowflake handles the refresh schedule. Because the Aiven free tier has no Kafka Connect, we use a relay consumer pattern:
Aiven Kafka (user-activity topic)
    ↓ 00_relay_consumer.py (Python micro-batch: flushes every 10 s or 500 records)
ADLS2: /nyc-taxi-data/streaming/user-activity/
    ↓ Snowpipe AUTO_INGEST (Azure Event Grid triggers COPY INTO on each new file)
STREAMING_BRONZE_USER_ACTIVITY   ← VARIANT column, one row per event
    ↓ Dynamic Tables (automatic incremental refresh)
STREAMING_SILVER / STREAMING_GOLD
Snowpipe (file-based ingest)
Snowpipe monitors an ADLS2 stage and automatically loads new files into a target table. Each relay flush (a ~10-second window of events) is one NDJSON file. Snowflake picks it up within ~30–60 seconds of the file landing.
This is a common production pattern for teams without Kafka Connect — not quite sub-second, but perfectly adequate for minute-level dashboards.
Dynamic Tables
A Dynamic Table is a Snowflake object defined by a SQL SELECT that refreshes automatically:
CREATE DYNAMIC TABLE streaming_silver_user_activity
    TARGET_LAG = '1 minute'
    WAREHOUSE  = DE_WORKSHOP_WH
AS
SELECT
    src:timestamp::TIMESTAMP_TZ     AS event_ts,
    src:user_id::VARCHAR            AS user_id,
    src:action::VARCHAR             AS action,
    src:country::VARCHAR            AS country,
    CASE src:action::VARCHAR
        WHEN 'purchase' THEN 'conversion'
        WHEN 'click'    THEN 'engagement'
        ELSE 'browse'
    END                             AS action_category
FROM streaming_bronze_user_activity
WHERE src:user_id::VARCHAR IS NOT NULL;
You don’t write streaming code — you write SQL. Snowflake computes the incremental changes and updates the Dynamic Table within the specified TARGET_LAG.
Exercise: Run the Snowflake streaming pipeline
Run
streaming/snowflake/01_setup_streaming.sqlasACCOUNTADMIN— loadsattendee_idandsas_tokenfrom_workshop_config; creates Bronze VARIANT table, stage, and SnowpipeConfirm the relay consumer is running (facilitator confirms) — rows start appearing in
STREAMING_BRONZE_USER_ACTIVITYRun
streaming/snowflake/02_dynamic_tables.sqlasACCOUNTADMIN— creates Silver + Gold Dynamic Tables (plus optionalSTREAMING_GOLD_TOP_PAGESfor facilitator demos)Switch to
DE_WORKSHOP_ROLE— wait 1 minute; Silver and Gold populate automaticallyPoll the Gold table to see live updates:
SELECT country, SUM(event_count) AS total_events, SUM(purchases) AS purchases
FROM DE_MASTERCLASS.{ATTENDEE_ID}_STREAMING.STREAMING_GOLD_ACTIVITY_BY_COUNTRY
GROUP BY country ORDER BY total_events DESC LIMIT 10;
 Part 3: dbt Dynamic Table Materialization
dbt supports Snowflake Dynamic Tables as a materialization type (materialized: dynamic_table). This means you write a standard dbt SQL model and add a single config option.
-- streaming/dbt/models/streaming_silver_user_activity.sql
{{ config(
    materialized = 'dynamic_table',
    target_lag   = '1 minute',
    snowflake_warehouse = 'DE_WORKSHOP_WH'
) }}

SELECT
    src:timestamp::TIMESTAMP_TZ     AS event_ts,
    src:user_id::VARCHAR            AS user_id,
    src:action::VARCHAR             AS action,
    src:country::VARCHAR            AS country,
    CASE src:action::VARCHAR
        WHEN 'purchase' THEN 'conversion'
        WHEN 'click'    THEN 'engagement'
        ELSE 'browse'
    END                             AS action_category
FROM {{ source('streaming_bronze', 'streaming_bronze_user_activity') }}
WHERE src:user_id::VARCHAR IS NOT NULL
Run it once:
dbt run --target snowflake --select streaming_silver_user_activity streaming_gold_activity_by_countryAfter that first run, dbt is done — Snowflake manages the continuous refresh. You get all of dbt’s benefits (lineage, docs, tests) on top of a streaming table.
WarningSnowflake only
The dynamic_table materialization requires the Snowflake adapter (dbt-snowflake >= 1.6.0). It is not supported on the Databricks backend. Use dbt run --target snowflake.
 Part 4: Power BI — Live Dashboard
The Gold tables produced in Parts 1–3 are ideal for a real-time dashboard. Using Power BI DirectQuery mode against the Snowflake Gold Dynamic Table, you can schedule an automatic page refresh so the numbers update without manual intervention.
Why DirectQuery + Dynamic Tables?
| Import mode | DirectQuery | |
|---|---|---|
| Data freshness | Stale until next scheduled refresh | Live — queries Snowflake on every page load |
| Best for | Large historical analysis | Small, frequently-changing aggregations |
| Fits our Gold table? | No — 1-min lag matters | ✅ Yes |
The STREAMING_GOLD_ACTIVITY_BY_COUNTRY Dynamic Table is already a small aggregation (~50–100 rows). DirectQuery is cheap and keeps the dashboard current.
Connection setup (Power BI Desktop)
- Get Data → Snowflake
- Server: account host from View account details (e.g.
el30551.west-europe.azure.snowflakecomputing.com) - Warehouse:
DE_WORKSHOP_WH - Database:
DE_MASTERCLASS - Data Connectivity mode: DirectQuery
- Server: account host from View account details (e.g.
- Select the Gold table
- Schema:
{ATTENDEE_ID}_STREAMING - Table:
STREAMING_GOLD_ACTIVITY_BY_COUNTRY
- Schema:
- Enable automatic page refresh
- View → Page Refresh → On
- Set interval: 1 minute (matches Dynamic Table
TARGET_LAG)
Recommended visuals
| Visual | Fields | Notes |
|---|---|---|
| Clustered bar chart | Axis: country, Value: SUM(event_count) |
Top 10 filter on country |
| Card | Value: SUM(purchases) |
“Total purchases (last hour)” |
| Line chart | X-axis: window_minute, Y: event_count, Legend: country |
Shows velocity over time |
| Table | country, event_count, purchases, unique_users, engagements |
Full breakdown |
DAX measure for the time filter display
Last Refreshed = "Updated: " & FORMAT(NOW(), "HH:MM:SS")Add this as a Card visual so attendees can see the page is live.
TipDemo tip (facilitator-led)
During the live session, the facilitator may start and stop the Aiven generator so you can see events pause and resume on the dashboard within 1–2 minutes.
Hands-on lab
Setup: Aiven streaming setup
Priya / Power BI: DirectQuery page with ~1-minute refresh — streaming Gold aggregates, not Import mode.
Next module
Module 9: Machine Learning (Optional) — Marcus wants to predict tip amounts on credit-card trips.