flowchart LR
    S["Azure ADLS2<br>Parquet + CSV"]

    subgraph DB["Databricks"]
        DB1["spark.read.parquet()<br>Direct cloud read"]
        DB2["PySpark DataFrame<br>filter / join / agg"]
        DB3["Delta Lake<br>open Parquet + txn log"]
        DB1 --> DB2 --> DB3
    end

    subgraph SF["Snowflake"]
        SF1["COPY INTO<br>from external stage"]
        SF2["CTAS / Snowpark<br>SQL or Python"]
        SF3["Snowflake storage<br>proprietary columnar"]
        SF1 --> SF2 --> SF3
    end

    subgraph DBT["dbt"]
        DBT1["source()<br>reads Bronze tables"]
        DBT2["SQL Jinja models<br>ref() for DAG"]
        DBT3["materialization<br>table / incremental / view"]
        DBT1 --> DBT2 --> DBT3
    end

    S --> DB1
    S --> SF1
    DB3 --> DBT1
    SF3 --> DBT1

    style S fill:#0057b8,color:#fff,stroke:#003d82
    style DB3 fill:#01065c,color:#fff,stroke:#000940
    style SF3 fill:#01065c,color:#fff,stroke:#000940
    style DBT3 fill:#01065c,color:#fff,stroke:#000940
Module 7: Comparison & Wrap-up
Power BI payoff and trainee-led tool discussion
![]()
![]()
![]()
![]()
Duration: 30 min — Animation (3) · Think & Discuss (5) · Theory (5) · Quiz (3) · Practice — Open Discussion (14)
1. Animation
2. Think & Discuss
Situation: Priya presented the full Power BI dashboard to Marcus. MHP’s engagement ends — you recommend a tool strategy for YellowLine NYC.
Prompts:
- Silent write (2 min, no talking) — My recommended stack is Databricks / Snowflake / dbt / combination. One sentence why.
- Silent write — One tool I would not choose as the primary platform and why.
- If Marcus’s team is SQL-only, what do you recommend?
- Look at your Story whiteboard — what would you change now that you have built all three pipelines?
- Could YellowLine NYC run only one of the three tools? What would they lose?
3. Theory
TipShort theory path
This module keeps theory brief before group discussion. Focus on objectives, Power BI demo notes, and when to use what. Full comparison tables and architectural gotchas are in Tool comparison deep dive for self-study after class.
Three constraints — back to the Story
Revisit the three constraints Marcus introduced on day one. Every Round 1 share and Round 2 challenge maps to one of them.
| Constraint | Use in discussion |
|---|---|
| Cost | “Year 3 TCO — does your stack still fit?” |
| Performance | “Will Module 8 streaming fit on this platform later?” |
| Compliance | “What proves a number to the auditor in Q3?” |
Decision-matrix handout: your facilitator provides a printed worksheet for the silent reflection step (2 min).
Closing line (Elena, Module 7 final slide):
“Technology is a decision. Architecture is responsibility.”
3.1 PowerBI Dashboard Demo (10 min)
Your facilitator demonstrates a pre-built Power BI dashboard connected to the Gold KPI tables. Everything uses Power BI Desktop (free) — no Pro or Premium license required.
Tip3.2 Build-along guide
Self-paced lab: Exercise: Power BI Dashboard (after Module 4 — five pages, all 12 KPIs). Extra DAX measures and theme JSON: Power BI DAX & theme reference.
Dashboard pages:
- Overview — KPI cards (total trips, revenue, avg fare, quality score), trips-by-hour line chart, day-of-week bar chart
- Map ⭐ — Shape map by borough (color = revenue), bubble map by top pickup zones (size = trips), popular routes table
- Time Analysis — Day × hour heatmap (matrix with gradient), time-of-day donut, revenue-by-hour column chart
- Revenue & Payments — Payment-type pie chart, detail table with conditional formatting, credit-card tip KPI card
- Efficiency — Distance vs. speed scatter, distance-band funnel, passenger-count breakdown
Key demo points:
- The same dashboard connects to Databricks or Snowflake Gold tables — schema is identical
- Shape maps (default + custom TopoJSON) show borough revenue; the Map visual with
Zone_Locationgeocodes top pickup zones - Power BI Desktop is free; publish to My Workspace (also free) for browser access
- Save as
.pbittemplate to share layout without credentials
3.3 Architecture: Three Pipelines, One Dataset
Tip3.4 Key insight
dbt is a transformation layer, not an ingestion tool. It reads from tables that Databricks or Snowflake already created. This is why you always need at least one other platform alongside dbt.
3.5 The same Silver transform — three ways
All three pipelines apply identical business logic. The platform changes only the how, not the what.
silver_df = bronze_df.filter(
    (col("fare_amount") > 0) &
    (col("trip_distance") > 0) &
    (col("passenger_count") > 0) &
    (col("tpep_pickup_datetime").isNotNull())
)
silver_df.write.mode("overwrite").saveAsTable("workshop.silver.nyc_taxi_enriched")
Compute runs on Spark executors. Delta Lake enforces schema on write.
CREATE OR REPLACE TABLE silver.nyc_taxi_enriched AS
SELECT *
FROM bronze.nyc_taxi_raw
WHERE fare_amount > 0
  AND trip_distance > 0
  AND passenger_count > 0
  AND tpep_pickup_datetime IS NOT NULL;
Compute runs inside a Snowflake virtual warehouse. Data stored in proprietary columnar format.
-- models/silver/silver_nyc_taxi_enriched.sql
{{ config(materialized='table') }}

SELECT *
FROM {{ ref('bronze_nyc_taxi_raw') }}
WHERE fare_amount > 0
  AND trip_distance > 0
  AND passenger_count > 0
  AND tpep_pickup_datetime IS NOT NULL
{ ref() } resolves the DAG. Compute runs on whichever backend dbt targets. dbt test validates nulls and counts automatically after the run.
3.6 When to Use What
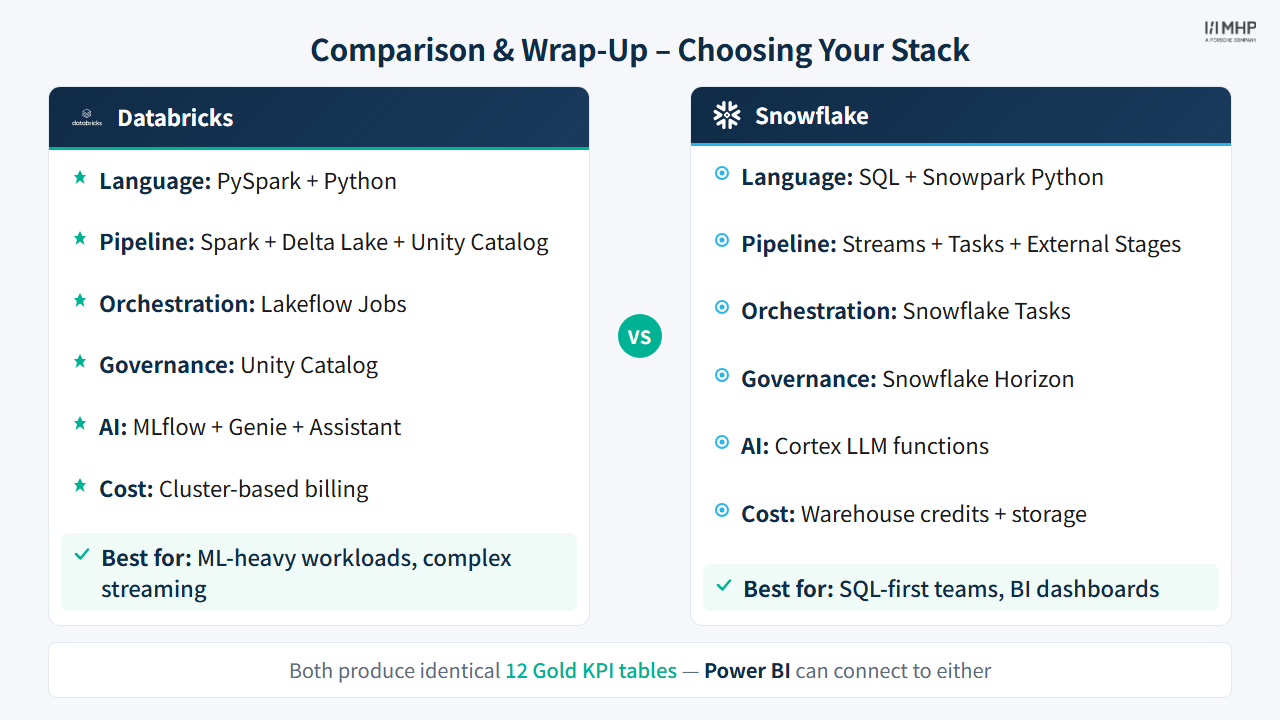
 Choose Databricks when:
- You need complex Python/Spark transformations
- ML/AI workloads are part of the pipeline
- You want unified analytics + ML on one platform
- Streaming workloads require sub-second latency (Structured Streaming)
- Team is comfortable with PySpark
 Choose Snowflake when:
- SQL is your team’s primary language
- You need instant, elastic compute scaling
- Data sharing across organizations is important
- You want both SQL and Python (Snowpark) options
- No-code ML (Cortex
ML.FORECAST,ML.ANOMALY_DETECTION) covers your use case - Near-real-time analytics (1-min lag) are sufficient — Dynamic Tables are simpler than Structured Streaming
 Choose dbt when:
- You want transformation-layer standardization
- Testing and documentation are priorities
- You need to run the same logic across multiple backends
- Your team values version-controlled, testable SQL
- You want an optional governed feature table with
dbt testcoverage in_DBT_GOLD— parallel to, not a prerequisite for, Databricks sklearn or Cortex ML
Combine tools when:
- Databricks + dbt: Databricks for ingestion/ML, dbt for transformation governance
- Snowflake + dbt: Snowflake for compute/storage, dbt for testing/docs/CI
- All three: Different teams, different strengths — dbt as the common layer
3.7 Discussion Questions
Use §2 Think & Discuss for the opening silent-write and pair prompts, §3.10 Review Questions for self-check before practice, and §5 Practice — Open Discussion for facilitator-led wrap-up. Extended prompts and comparison tables: Tool comparison deep dive.
3.8 Key Takeaways
- There is no single best tool — each excels in different scenarios
- Medallion architecture works across all tools — the pattern transcends tooling
- Production pipelines look very different from training notebooks
- AI features are rapidly becoming standard in every data engineering tool
- ML (Module 9) extends batch Silver into tip-prediction features; streaming (Module 8) uses a separate Aiven user-activity dataset — not NYC Taxi Bronze
- Snowflake Cortex ML covers the majority of business ML needs with zero Python
- Databricks remains the stronger choice when algorithm flexibility or deep MLflow tracking matters
- The ability to compare tools hands-on is the best way to make informed decisions
3.9 Further Learning
Official documentation
| Tool | Page | What it covers |
|---|---|---|
| What is Delta Lake? | Open format, ACID, time travel, schema enforcement | |
| High-level architecture | Control plane vs compute plane, serverless vs classic | |
| Overview of data loading | COPY INTO, stage types, INFER_SCHEMA, DML error logging |
|
| Virtual warehouses | Sizes, auto-suspend, credit billing model | |
| Cortex ML Functions | FORECAST, ANOMALY_DETECTION, CLASSIFICATION, TOP_INSIGHTS | |
| Snowflake Model Registry | Snowpark ML models (not Cortex ML Functions — those are separate) | |
| Materializations | All 5 types, Python models, dynamic_table vs materialized_view |
|
| Snowflake-specific configs | Why Snowflake uses dynamic_table not materialized_view |
Extended learning
- Delta Lake open protocol
- Snowpark Developer Guide
- Databricks MLflow
- Aiven Free Kafka (streaming broker used in Module 8)
- Aiven Karapace Schema Registry
- dbt Best Practices — Real-time data
NoteSelf-study reference
Detailed comparison tables, integration gotchas, discussion questions, and further reading: Tool comparison deep dive
3.10 Review Questions
Before open discussion, make sure you can answer:
- Name one scenario where Databricks is the clear winner over Snowflake, and one where Snowflake wins.
- Why is dbt always used alongside another platform — never alone?
- What are Marcus’s three constraints, and which tool selection decision does each one influence?
4. Quiz
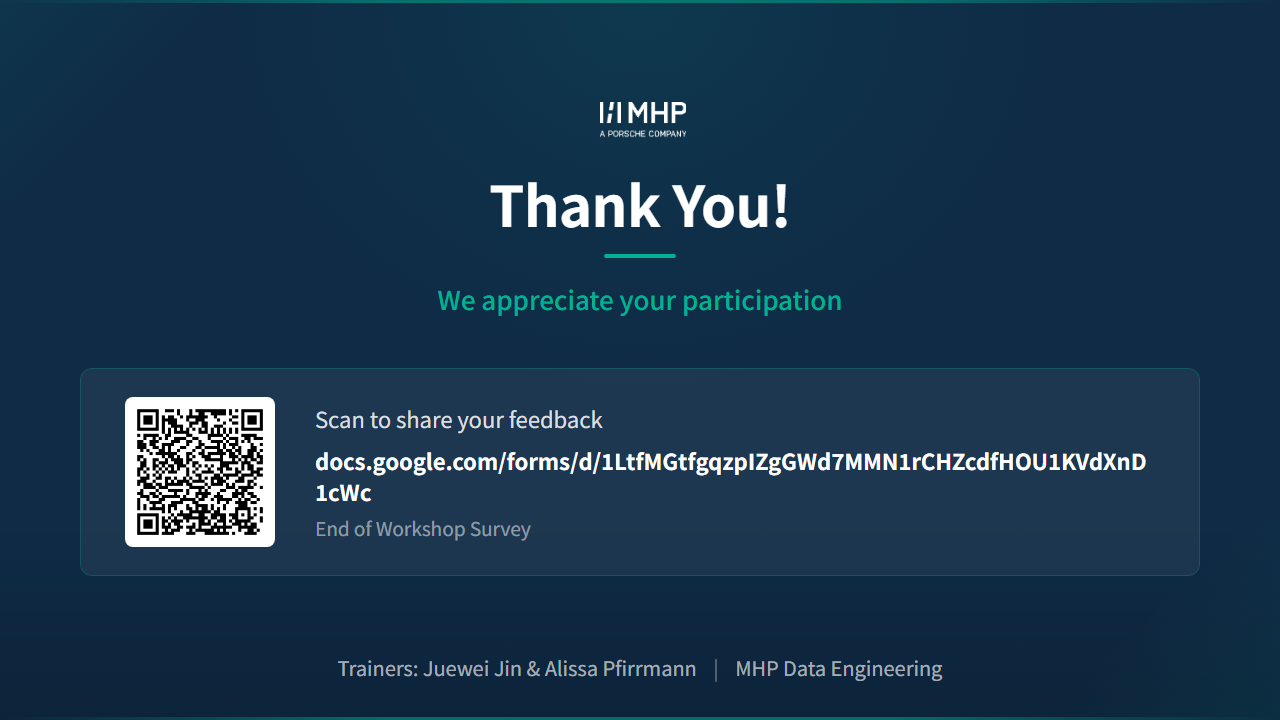
Before open discussion — share the wrap-up quiz and end-of-workshop survey:
Module 7 — Comparison & Wrap-up Quiz · End-of-workshop survey
All module quiz links: Quiz & feedback forms
5. Practice — Open Discussion
Facilitator-led group discussion: compare Databricks, Snowflake, and dbt for YellowLine NYC and agree on a recommendation for Marcus.
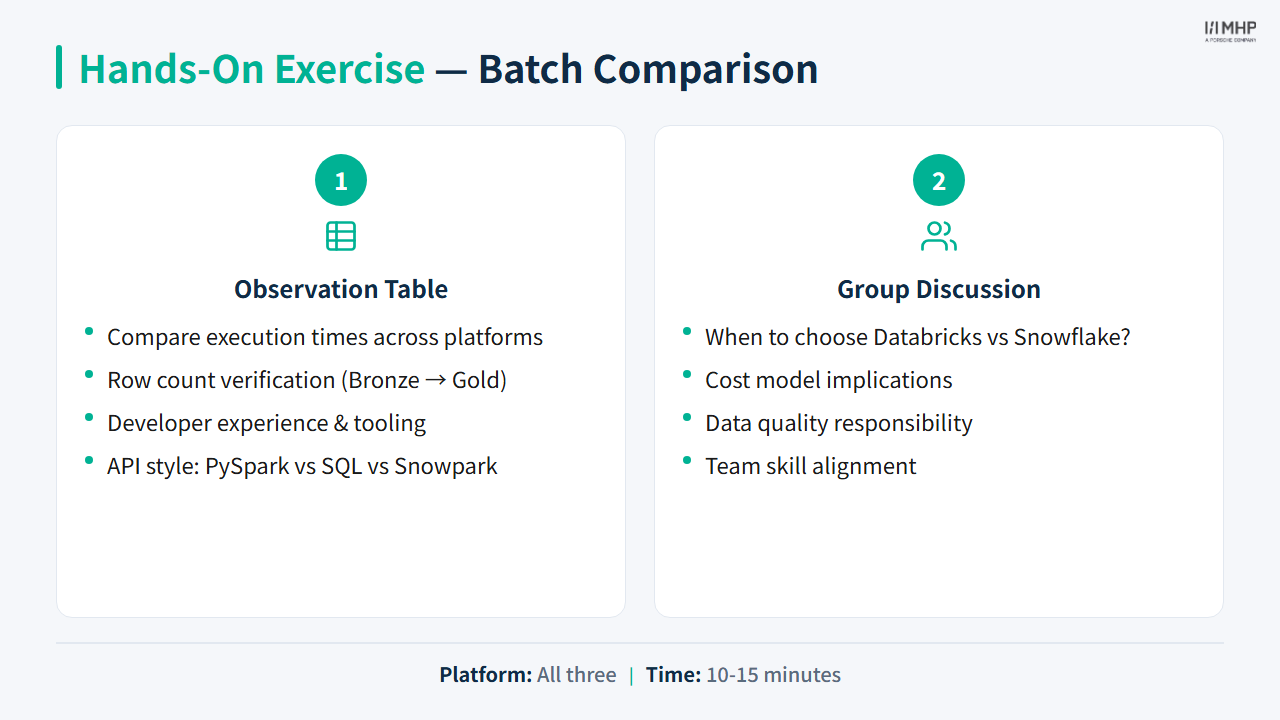
Optional opener: Batch comparison exercise
Optional: Power BI demo (10 min)
Connect the same Gold schema live or walk through Exercise: Power BI; use the DAX & theme reference for optional measures.
Priya / Power BI: Full dashboard walkthrough — Overview, Map, Time Analysis, Revenue, Efficiency — all 12 KPIs.
Next module
Module 8: Streaming (Optional) — Optional Phase 2: Marcus needs live dispatch, then tip prediction (Module 9).